Sneaker Reselling Statistics 2026: Market Size, Growth, Platforms & Demand
A complete breakdown of the sneaker resale market in 2026. We cover market size, platform growth, pricing trends, bot activity, and buyer demographics with verified stats and sources.

Gunnar
Last updated -
Why Hype Proxies

The sneaker resale market has grown into a multi-billion-dollar industry, and the infrastructure behind it has evolved just as fast.
At HypeProxies, we work directly with resellers, bot operators, and automation teams who live inside this ecosystem every day.
So we put together the most comprehensive set of sneaker reselling statistics for 2026. It covers market size, platform growth, pricing trends, bot activity, and buyer demographics to give you a clear picture of where the market stands and where it’s heading.
These numbers tell you a full story of what has been happening around the industry. So if you are a developer building automation tools or a data company tracking the sneaker economy, the stats here would help you to decide.
Stats on Sneaker Market Size & Resale Growth
Projected Stats of 2026 & coming years
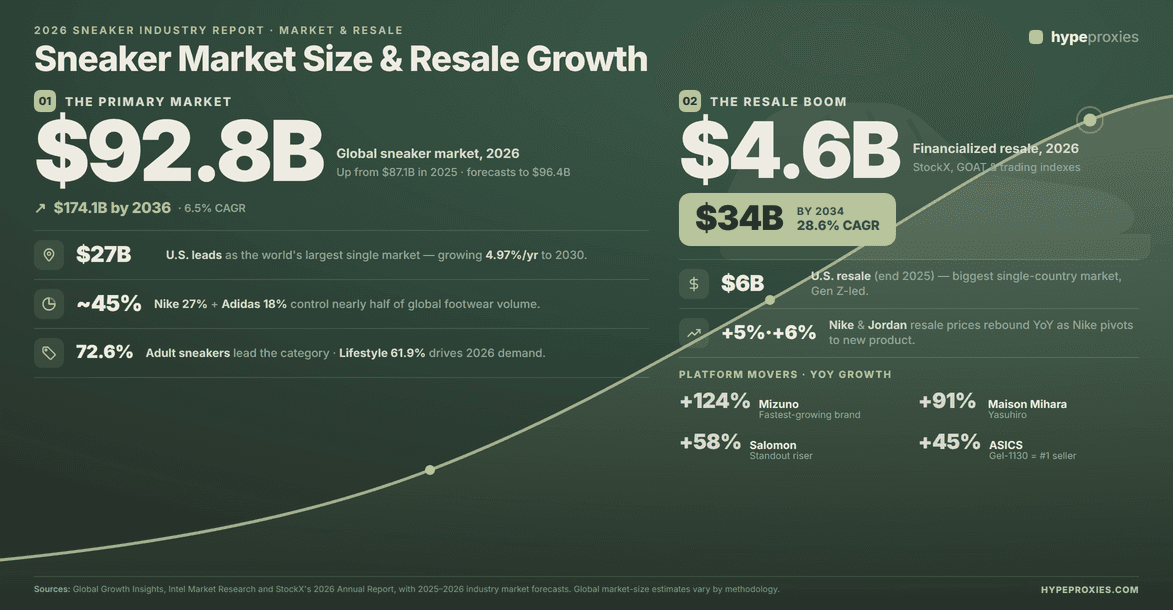
The global sneaker market was valued at USD 99.1 billion in 2025 and is projected to reach USD 159.4 billion by 2034, growing at a CAGR of 5.26% during 2026–2034. This massive primary market sustains the pipeline of desirable products that feed secondary-market demand. (Source)
The global sneakers market is set to hit $96.37 billion in 2026, led heavily by the United States at an estimated US$27 billion growing at a steady annual rate of 4.97% until 2030 from brand market point of view. (Source)
The United States dominates the market by generating the most revenue in the Sneakers market, which is estimated to reach US$27bn in 2026. (Source)
According to 2026 global sneaker market forecasts from Global Growth Insights 2026, Nike and Adidas continue to anchor the industry by controlling 27% and 18% of global demand respectively, collectively commanding nearly half of the worldwide footwear volume. (Source)
The global sneaker resale market, when looking strictly at highly structured, data-driven digital marketplaces (like StockX, GOAT, and high-velocity trading indexes), 2026 data from Intel Market Research narrows this down to a pure 'financialized' asset market of USD 4.6 billion, projected to increase by USD 34 billion by 2034 at an aggressive 28.6% CAGR. (Source)
According to StockX's newest annual report released for the 2026, resellers are no longer just looking at legacy Jordan retros; instead, Nike has pivoted to brand-new product innovations to spark a recovery. Nike and Jordan resale prices on the secondary market rebounded, entered 2026 with average resale prices climbing up 5% (Nike) and 6% (Jordan) year-over-year. (Source)
StockX explicitly reports that ASICS continued its market leadership with a 45% YoY increase, officially confirming the Gel-1130 (specifically the Black/Pure Silver colorway) as the absolute best-selling sneaker on the entire platform. Mizuno capturing the No. 1 spot as the fastest-growing sneaker brand with an explosive 124% year-over-year sales surge, followed closely by Maison Mihara Yasuhiro at 91% growth. (Source1) (Source2)
Previous Years Stats
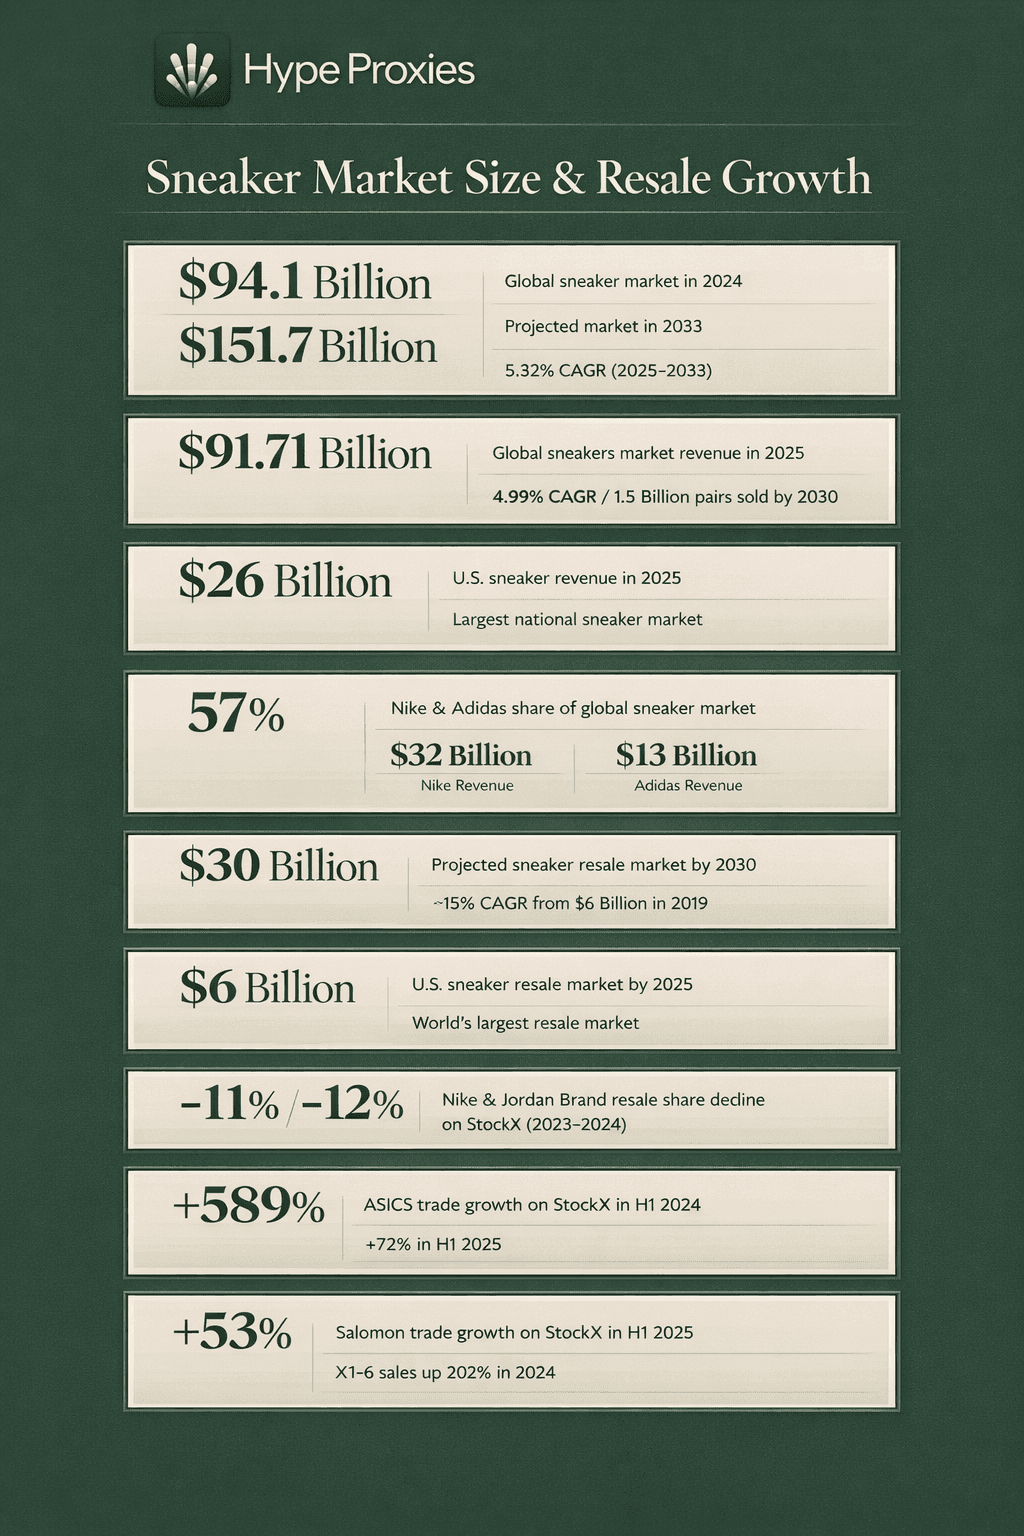
The global sneaker market was valued at $94.1 billion in 2024 and is projected to reach $157.9 billion by 2033, growing at a CAGR of 5.32% during 2025–2033. This massive primary market sustains the pipeline of desirable products that feed secondary-market demand. (Source)
Global sneakers market revenue in 2025 stands at $91.71 billion, with a projected 4.99% CAGR through 2030 and an expected annual volume of 1.5 billion pairs sold by 2030. Sneaker resellers operate in the world's largest footwear subcategory. (Source)
The United States generated approximately $26 billion in sneaker revenue in 2025, making it the single largest national sneaker market and the epicentre of resale activity and pricing trends. (Source)
Nike and Adidas together control approximately 57% of the global sneaker market, with Nike’s footwear revenue at roughly $33 billion and Adidas at approximately $13 billion in 2024–2025. (Source)
The global sneaker resale market was valued at $6 billion in 2019 and is projected to reach $30 billion by 2030, implying a ~15% CAGR. This is the most widely cited resale market projection, establishing sneakers as a legitimate alternative asset class. (Source)
The U.S. sneaker resale market reached $6 billion by the end of 2025, driven by Gen Z investment behaviour and robust platform infrastructure. The U.S. remains the world’s largest single-country resale market. (Source)
Nike and Jordan Brand resale market share dropped 11% and 12%, respectively, on StockX from 2023 to 2024. The erosion of traditional powerhouses signals a major structural shift requiring resellers to diversify beyond legacy brands. (Source)
ASICS recorded +589% year-over-year trade growth on StockX in H1 2024, followed by +71% in H1 2025, making it the #1 fastest-growing sneaker brand on StockX for two consecutive years. The ASICS Gel-1130 became StockX’s best-selling sneaker in 2025. Early movers on challenger brands captured outsized margins. (Source)
Salomon posted +53% trade growth in H1 2025 on StockX, returning to the #3 fastest-growing brand. The XT-6 saw secondary sales increase 202% during 2024. Salomon’s resurgence demonstrates the cyclical nature of brand heat on resale platforms. (Source)
Statistics on Resale Platform Metrics
Projected Stats of 2026 & coming years
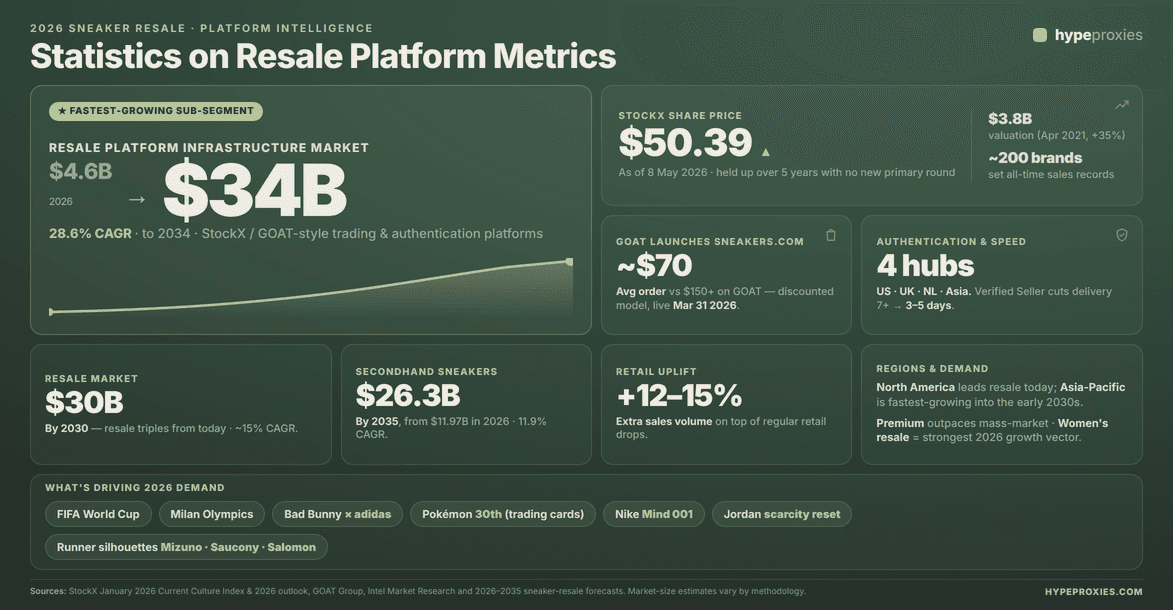
In major markets, the sneaker resale business now adds an extra 12% to 15% in sales volume on top of regular retail drops. This massive overlap shows that the secondary market is no longer just a side hustle, but a main pillar of how the entire footwear industry operates. (Source)
In its January 2026 Current Culture Index, StockX disclosed that nearly 200 brands set all-time annual sales records on the platform, and forecast 2026 demand to be lifted by the FIFA World Cup, the Milan Olympics, and Bad Bunny's first adidas signature sneaker. (Source)
StockX shares at $50.39 as of 8 May 2026, suggesting investor appetite has held up despite five years without a fresh primary round. StockX achieved a $3.8 billion valuation in April 2021 following a $255 million financing round, a 35% increase from its $2.8 billion December 2020 valuation. (Source)
StockX's 2026 outlook calls out re-commerce acceleration, trading-card growth anchored by Pokémon's 30th anniversary, and continued momentum for runner-inspired silhouettes from Mizuno, Saucony, and Salomon. The global sneaker resale market is projected to reach $30 billion by 2030 — a ~15% CAGR. (Source1) (Source2)
Resale specifically is projected to triple from current levels to $30 billion by 2030. The global secondhand sneakers market is projected at $11.97 billion in 2026, scaling to $26.3 billion by 2035 at a CAGR of 11.9%. North America remains the leading region for sneaker resale. (Source)
GOAT Group officially launched Sneakers.com on March 31, 2026, offering steeply discounted sneakers in place of the premium, scarce secondhand product it became well-known for hosting. Unlike GOAT’s other platforms, where you’ll see most sneakers priced at $150 USD or more, on Sneakers.com, orders average at $70 USD. (Source)
StockX have authentication centres in the USA, UK, Netherlands, and Asia — supporting international sneaker resale at scale. StockX introduced its Verified Seller program, allowing a limited number of pre-verified sellers with strong track records to ship directly to buyers, bypassing the authentication center cutting standard delivery from 7+ days to 3–5 business days. (Source1) (Source2)
The global sneaker resale platform infrastructure market (StockX/GOAT-style trading and authentication platforms) is projected at $4.6 billion in 2026, scaling to $34 billion by 2034 at a 28.6% CAGR — the fastest-growing sub-segment within the sneaker resale ecosystem.
Nike enters 2026 with renewed sneaker-resale momentum, anchored by new releases like the Nike Mind 001 and a more disciplined Jordan Brand supply strategy aimed at restoring scarcity premiums on core silhouettes — a deliberate move to lift secondary-market pricing across the platform. (Source)
Asia-Pacific is the fastest-growing regional sneaker resale market into the early 2030s, outpacing North America and Europe. (Source)
Within the sneaker resale market, the premium segment is expanding faster than mass-market, with women's sneaker resale the strongest demographic growth vector in 2026. (Source)
Previous Years Stats
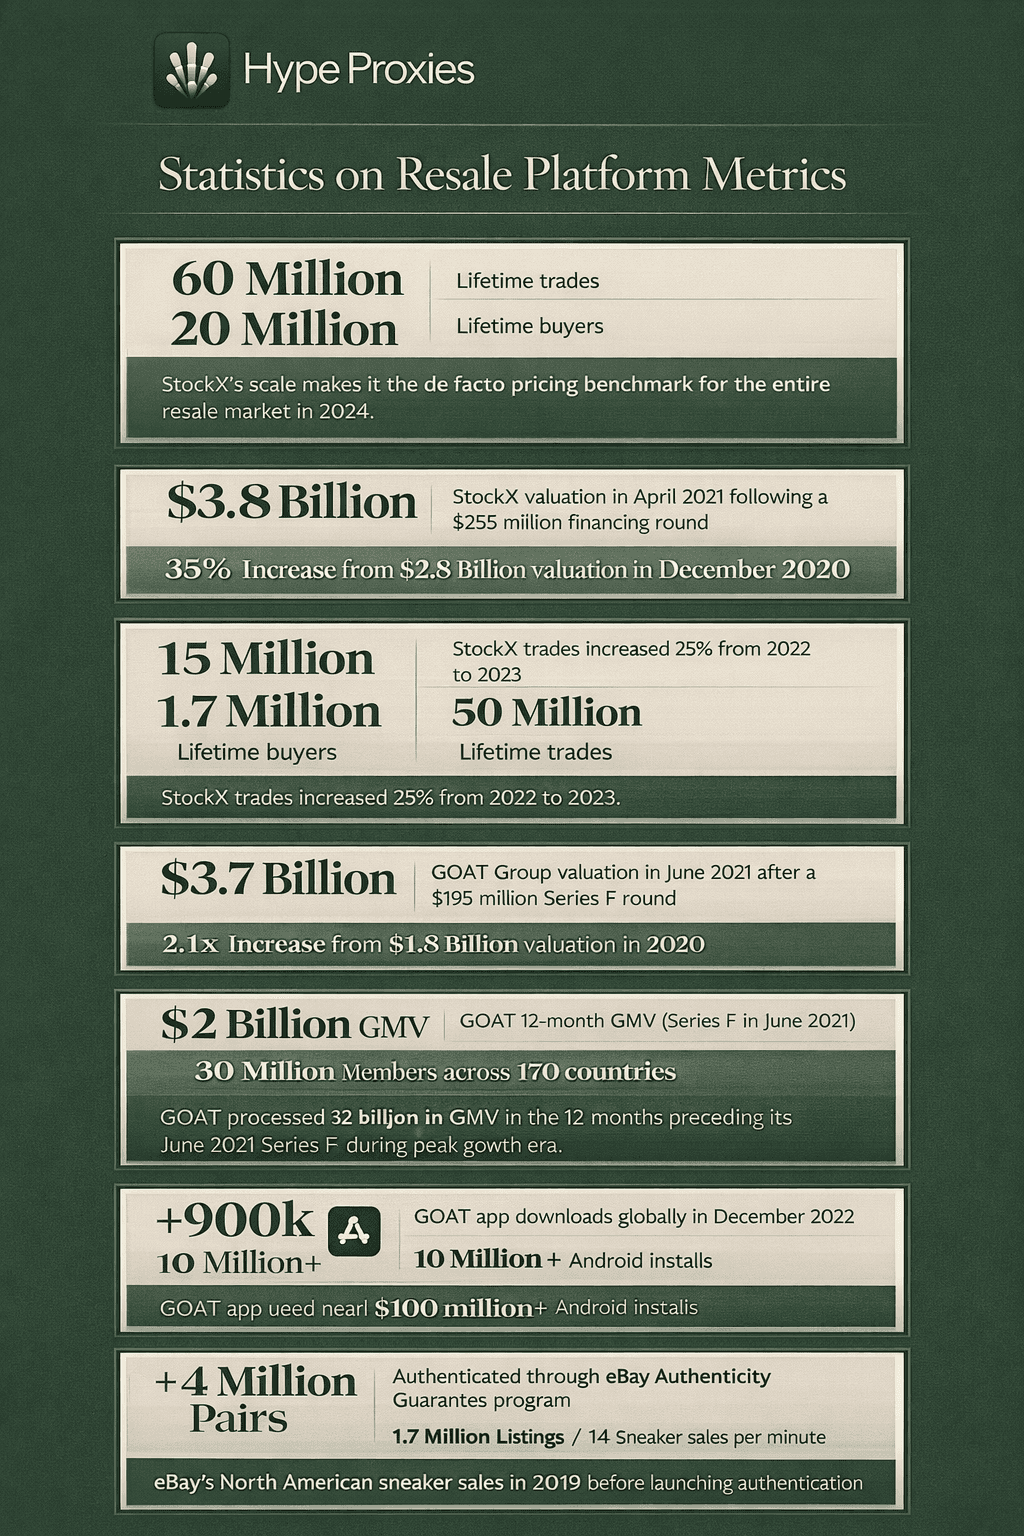
StockX surpassed 60 million lifetime trades and 20 million lifetime buyers in 2024, with more than 100 brands closing the year with record sales on the platform. StockX’s scale makes it the de facto pricing benchmark for the entire resale market. (Source)
StockX achieved a $3.8 billion valuation in April 2021 following a $255 million financing round, a 35% increase from its $2.8 billion December 2020 valuation. This remains StockX’s most recent public valuation. (Source)
By the end of 2023, StockX reported 15 million lifetime buyers, 1.7 million lifetime sellers, and 50 million lifetime trades, a 25% increase in trades from 2022. Continued trade growth showed platform resilience despite economic headwinds. (Source)
GOAT Group reached a $3.7 billion valuation in June 2021 after a $195 million Series F round, more than doubling its prior $1.8 billion valuation. GOAT delivers products to over 30 million members across 170 countries. (Source)
GOAT processed $2 billion in GMV in the 12 months preceding its June 2021 Series F, contextualising its competitive positioning against StockX during the peak growth era. (Source)
The GOAT app was downloaded over 900,000 times globally in December 2022 and has accumulated 10 million+ Android installs. Monthly download volumes in the hundreds of thousands demonstrate sustained mobile-first demand for sneaker resale. (Source)
eBay has authenticated more than 4 million shoes globally through its Authenticity Guarantee program, with an average of 1.7 million sneaker listings live daily and 14 pairs sold per minute. eBay’s massive authentication infrastructure competes directly with StockX and GOAT. (Source)
eBay sold approximately 6 million sneakers in 2019 across North America, a sneaker every 1.5 seconds, even before launching its targeted authentication investments (Source)
Statistics on Pricing & Profit Margins
Projected Stats of 2026 & coming years
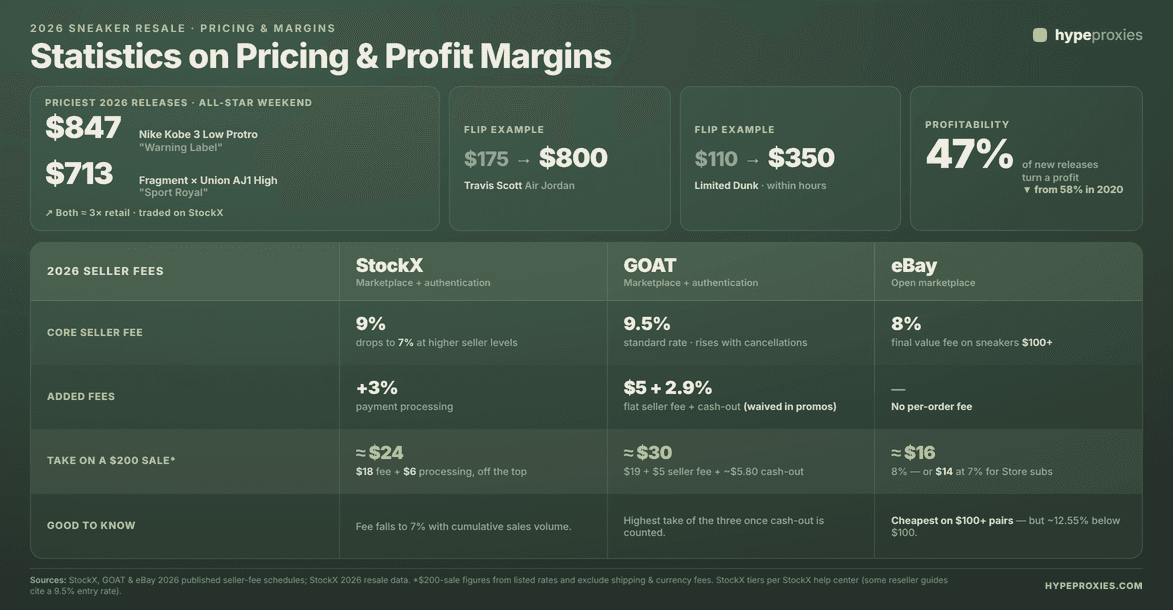
The 2026 NBA All-Star Weekend produced the most expensive resale releases of the year so far — the "Warning Label" Nike Kobe 3 Low Protro hit $847 and the "Sport Royal" Fragment x Union Air Jordan 1 High traded at $713 on StockX, both at roughly triple their retail prices. (Source)
A pair of Travis Scott Jordans bought for $175 flips for $800. Limited Dunks that cost $110 resell for $350 within hours. But sneaker reselling in 2026 looks different than it did a few years ago. The days of easy profits on every release are over. Only about 47% of new releases turn a profit now, down from 58% in 2020. (Source)
StockX charges sellers a transaction fee starting at 9% plus a 3% payment processing fee on every sale. The transaction fee drops as low as 7% once you reach higher seller levels based on cumulative sales volume. On a $200 sneaker sale at the entry level, that means $18 in transaction fees plus $6 in payment processing means $24 off the top before you factor in your shipping cost to the StockX authentication center. (Source)
GOAT's 2026 fee model charges a 9.5% commission — the standard rate for sellers in good standing — plus a flat seller fee that runs $5 in the US (up to $30 in some regions), and a separate 2.9% cash-out fee applied when you withdraw earnings, which GOAT may waive during promotional campaigns. (Source)
eBay's 2026 sneaker fees are an 8% final value fee on sneakers selling for $100 or more, with the per-order fee waived, and eBay Store subscribers (Basic and above) pay just 7%. Below $100, the rate jumps to roughly 12.55% (or 11.7% for Store subscribers), so eBay's lower fees are a major margin advantage on higher-priced shoes. (Source)
Previous Years Stats
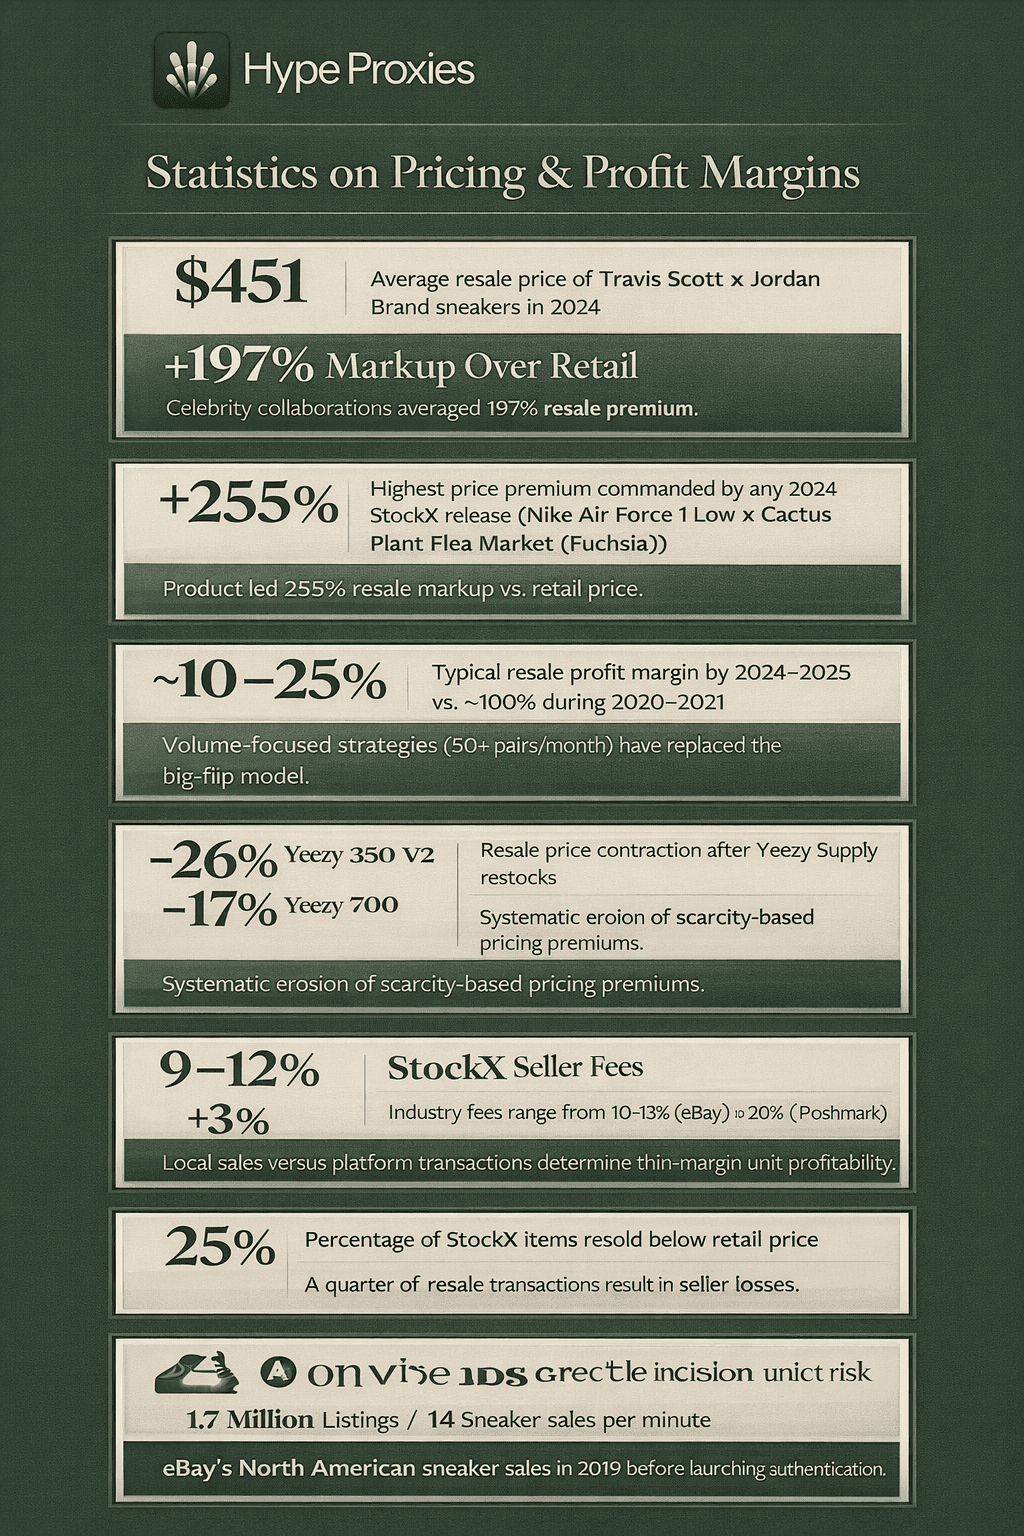
Travis Scott x Jordan Brand collaborations averaged a $451 resale price in 2024, representing a 197% markup over retail. Celebrity collaborations continue to defy the broader margin compression trend. (Source)
The Nike Air Force 1 Low x Cactus Plant Flea Market (Fuchsia) achieved the highest price premium of any 2024 StockX release at 255% above retail. Limited collaborations with strong cultural cachet can still command 2.5x markups. (Source)
Profit margins for most sneaker resellers have compressed from ~100% during the 2020–2021 pandemic boom to 10–25% per pair by 2024–2025. Volume-based strategies of 50+ pairs per month have replaced the single-shoe, big-flip model. (Source)
Yeezy 350 V2 resale prices declined by 26% following Yeezy Supply restocks; Yeezy 700 models declined by 17%. Each restock wave systematically eroded scarcity-based pricing premiums. (Source)
StockX seller transaction fees range from 9% to 12% plus a 3% processing fee, while industry platform fees range from 10–13% on eBay to 20% on Poshmark. The difference between selling on a platform versus locally determines profitability on thin-margin pairs. (Source)
Approximately 25% of items sold on StockX trade for below retail price. A quarter of all resale transactions represent seller losses, underscoring the market’s significant downside risk. (Source)
Statistics on Limited Release Demand
Projected Stats of 2026 & coming years
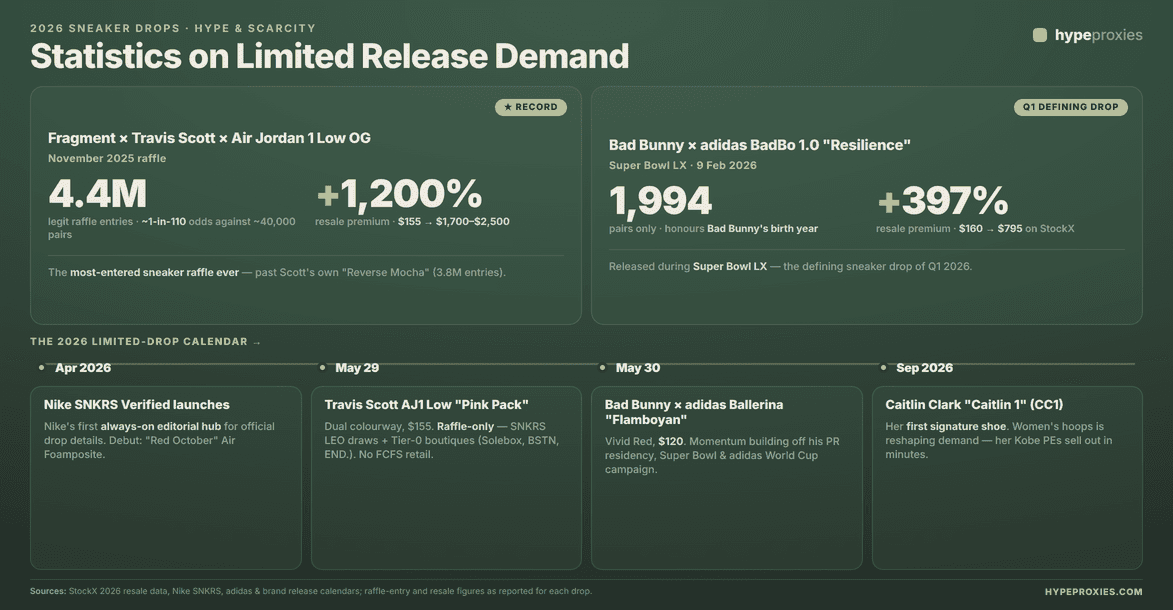
The Fragment Design x Travis Scott x Air Jordan 1 Low OG drew 4.4 million legitimate raffle entries in November 2025 against an estimated 40,000-pair production run — roughly 1-in-110 odds per entry. The $155 retail shoe now trades at $1,700–$2,500 in 2026 (~1,200% premium), holding its position as the most-entered sneaker raffle ever and overtaking Scott's own "Reverse Mocha" record of 3.8 million entries. (Source)
The Bad Bunny x adidas BadBo 1.0 "Resilience" dropped at Super Bowl LX on 9 February 2026 in a limited production run of just 1,994 pairs (honouring Bad Bunny's birthday year). The shoe retailed at $160 and now carries an average resale price of $795 on StockX — a ~397% premium — making it the defining sneaker drop of Q1 2026. (Source)
The Travis Scott x Air Jordan 1 Low OG "Pink Pack" drops a dual-colourway release on 29 May 2026 (Muslin Shy Pink and Sail Tropical Pink) at $155 / €160 retail, allocated entirely via Nike SNKRS LEO draws and Tier-0 boutique raffles (Solebox, BSTN, END.). No first-come-first-served retail availability anywhere. (Source)
Nike launched SNKRS Verified in April 2026 — its first always-on editorial programme centralising official details on upcoming limited drops, debuting with the "Red October" Nike Air Foamposite among other Q2 2026 releases. (Source)
The Bad Bunny x adidas Ballerina "Flamboyan" Vivid Red drops 30 May 2026 at $120 retail. Expect the high demand silhouette to continue gathering steam after releases at Bad Bunny’s Puerto Rico residency, Super Bowl performance and adidas worldwide World Cup marketing campaign. (Source)
Women's basketball is reshaping limited-release demand in 2026. Caitlin Clark's Nike Kobe Protro Player Exclusives have sold out within minutes of public release. Her first signature shoe, the Nike "Caitlin 1" (CC1), is going to launch in September 2026. (Source)
Previous Years Stats
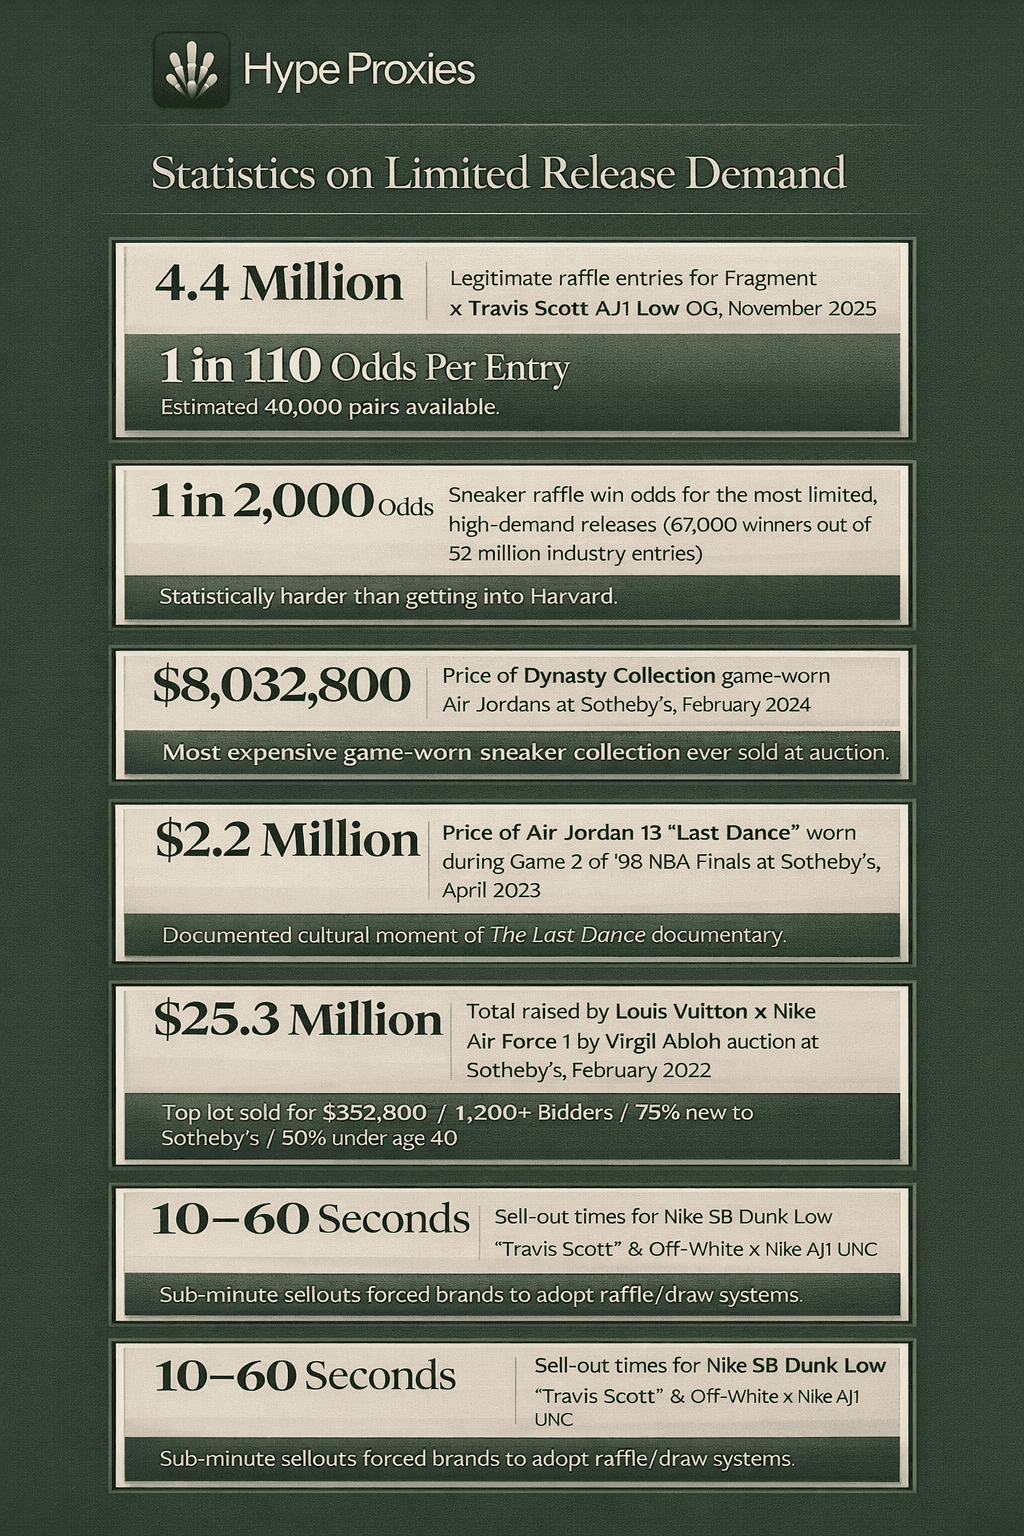
The Fragment Design x Travis Scott x Air Jordan 1 Low OG drew 4.4 million legitimate raffle entries in November 2025, breaking the all-time sneaker raffle record. With an estimated ~40,000 pairs available, this translates to roughly 1-in-110 odds per entry. (Source)
Sneaker raffle win odds are approximately 1 in 2,000 for the highest-demand releases, with 67,000 winners out of 52 million entries across industry raffles. Winning a sneaker raffle on the most hyped drops is statistically harder than getting into Harvard. (Source)
The “Dynasty Collection” of six game-worn Air Jordans from Michael Jordan’s six championship seasons sold for $8,032,800 at Sotheby’s in February 2024, setting a Guinness World Record for the most expensive game-worn sneaker collection ever sold at auction. (Source)
The Air Jordan 13 “Last Dance” worn during Game 2 of the 1998 NBA Finals sold for $2.2 million at Sotheby’s in April 2023, fueled by the cultural moment created by The Last Dance documentary. (Source)
The Louis Vuitton x Nike Air Force 1 by Virgil Abloh auction raised $25.3 million total across 200 pairs at Sotheby’s in February 2022, with the top lot selling for $352,800. The auction attracted 1,200+ bidders, a Sotheby’s record, with 75% new to the auction house and over half under age 40. (Source)
The Nike SB Dunk Low “Travis Scott” historically sold out with some sizes gone in as little as 10 seconds; the Off-White x Nike Air Jordan 1 UNC sold out in under one minute. Sub-minute sell-out times are the primary driver forcing brands to adopt raffle and draw systems. (Source)
Statistics on Botting and Automation
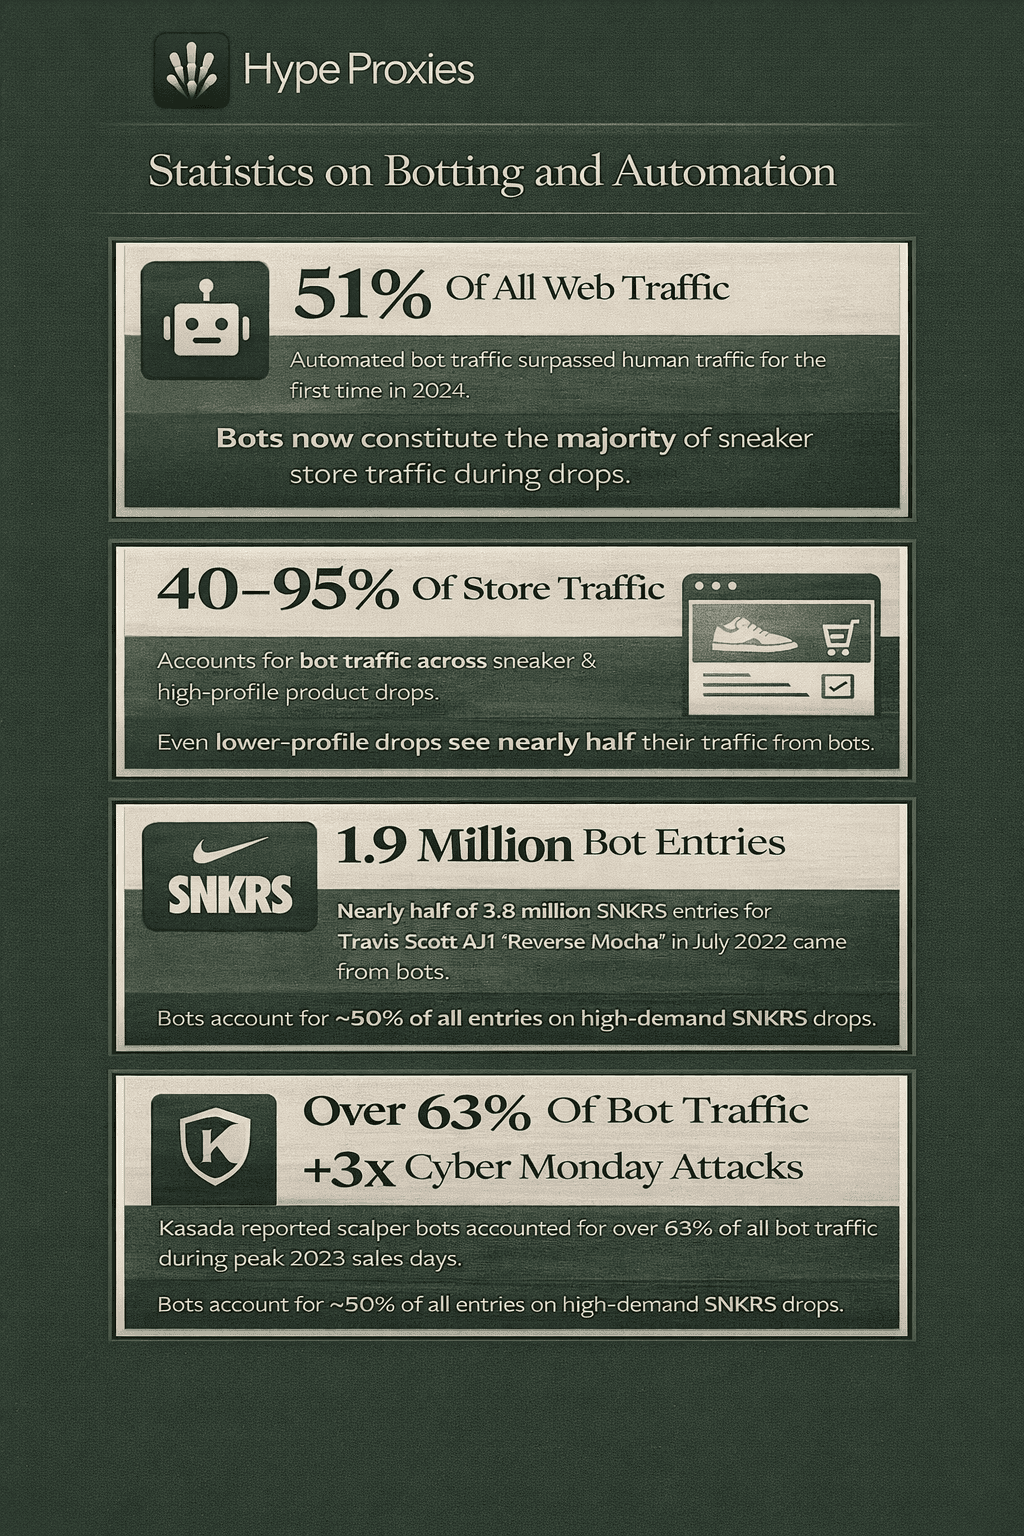
Automated bot traffic surpassed human traffic for the first time in 2024, constituting 51% of all web traffic. Sneaker retailers must now assume the majority of their traffic during drops is non-human. (Source)
Across sneaker and high-profile product drops, 40% to 95% of web shop traffic comes from sneaker bots. Even lower-profile drops see nearly half their traffic from automated buyers. (Source)
The Travis Scott x Air Jordan 1 “Reverse Mocha” received close to 3.8 million SNKRS entries, of which approximately 1.9 million (nearly 50%) were bot-generated. Bots account for roughly half of all entries on hyped SNKRS releases. (Source)
Kasada reported that scalper bots accounted for over 63% of all bot traffic during peak 2023 sales days, with automated checkout attempts spiking 3x on Cyber Monday. Peak shopping periods see the most concentrated bot attacks sniping limited inventory. (Source)
Conclusion
The sneaker resale market is not slowing down. If anything, the data makes one thing clear. The opportunity is still very much there, but the game has changed. Margins are tighter, competition is fiercer, and the window to cop a hyped release closes faster than ever.
Resellers who are winning today are not relying on luck. They are running the right sneaker proxy paired with complementary tools on infrastructure built for speed and consistency.
At HypeProxies, we provide fast ISP proxies & sneaker proxies with clean IP reputation, unlimited bandwidth for US & Canada coverage.
If you are ready to build a setup that actually performs, you can start here & test our proxies at $1.
Share on

$1 one-time verification. Unlock your trial today.
Stay in the loop
Subscribe to our newsletter for the latest updates, product news, and more.
No spam. Unsubscribe at anytime.